Unadjusted vs. Adjusted Pay Gaps

If you're reporting both the unadjusted and adjusted pay gap, whether for compliance with the EU Pay Transparency Directive or a pay equity audit, you've probably noticed the confusing number of articles online that dance around your real question: how exactly is an adjusted gap calculated? Most sources stay vague or oversimplify often because they are trying to sell you a solution to a problem that, in principle, is not that hard. Let's take a clear look at the process, the math, the assumptions, and the data decisions involved so you can walk away with a defensible and repeatable approach. Hint: the hard part is not the math, it's organizing your data.
Unadjusted Pay Gap: A Starting Point
The unadjusted pay gap is the blunt instrument of pay transparency. It's simple: take the average salary of men and subtract the average salary of women, then divide by the average salary of men.
Let's say:
-
Men at your company earn an average of $100,000
-
Women earn an average of $85,000
-
Then your unadjusted pay gap is 15%.
Unadjusted Pay Gap Formula:
This metric is easy to calculate and is widely used in compliance reporting, including the UK Gender Pay Gap Report, Australia's WGEA disclosues, and the EU Pay Transparency Directive. However, the unadjusted gap compares only overall averages and ignores job differences. There is no way to tell from an unadjusted pay gap whether people working the same job earn the same pay.
Adjusted Pay Gap: Apples to Apples? Try Onions to Onions.
The adjusted pay gap answers a more nuanced question: Are people doing equal work of equal value paid equally? To get there, we build a statistical model that holds constant factors like:
-
Job level or seniority
-
Function or job family
-
Location (geo band, country, metropolitan city, region call all be included)
-
Tenure
-
Potential Prior Experience
-
Education level
-
Job characteristics like skill, effort, responsibility, and working conditions
-
Peformance scores (if measured objectively, remember: bias in bias out)
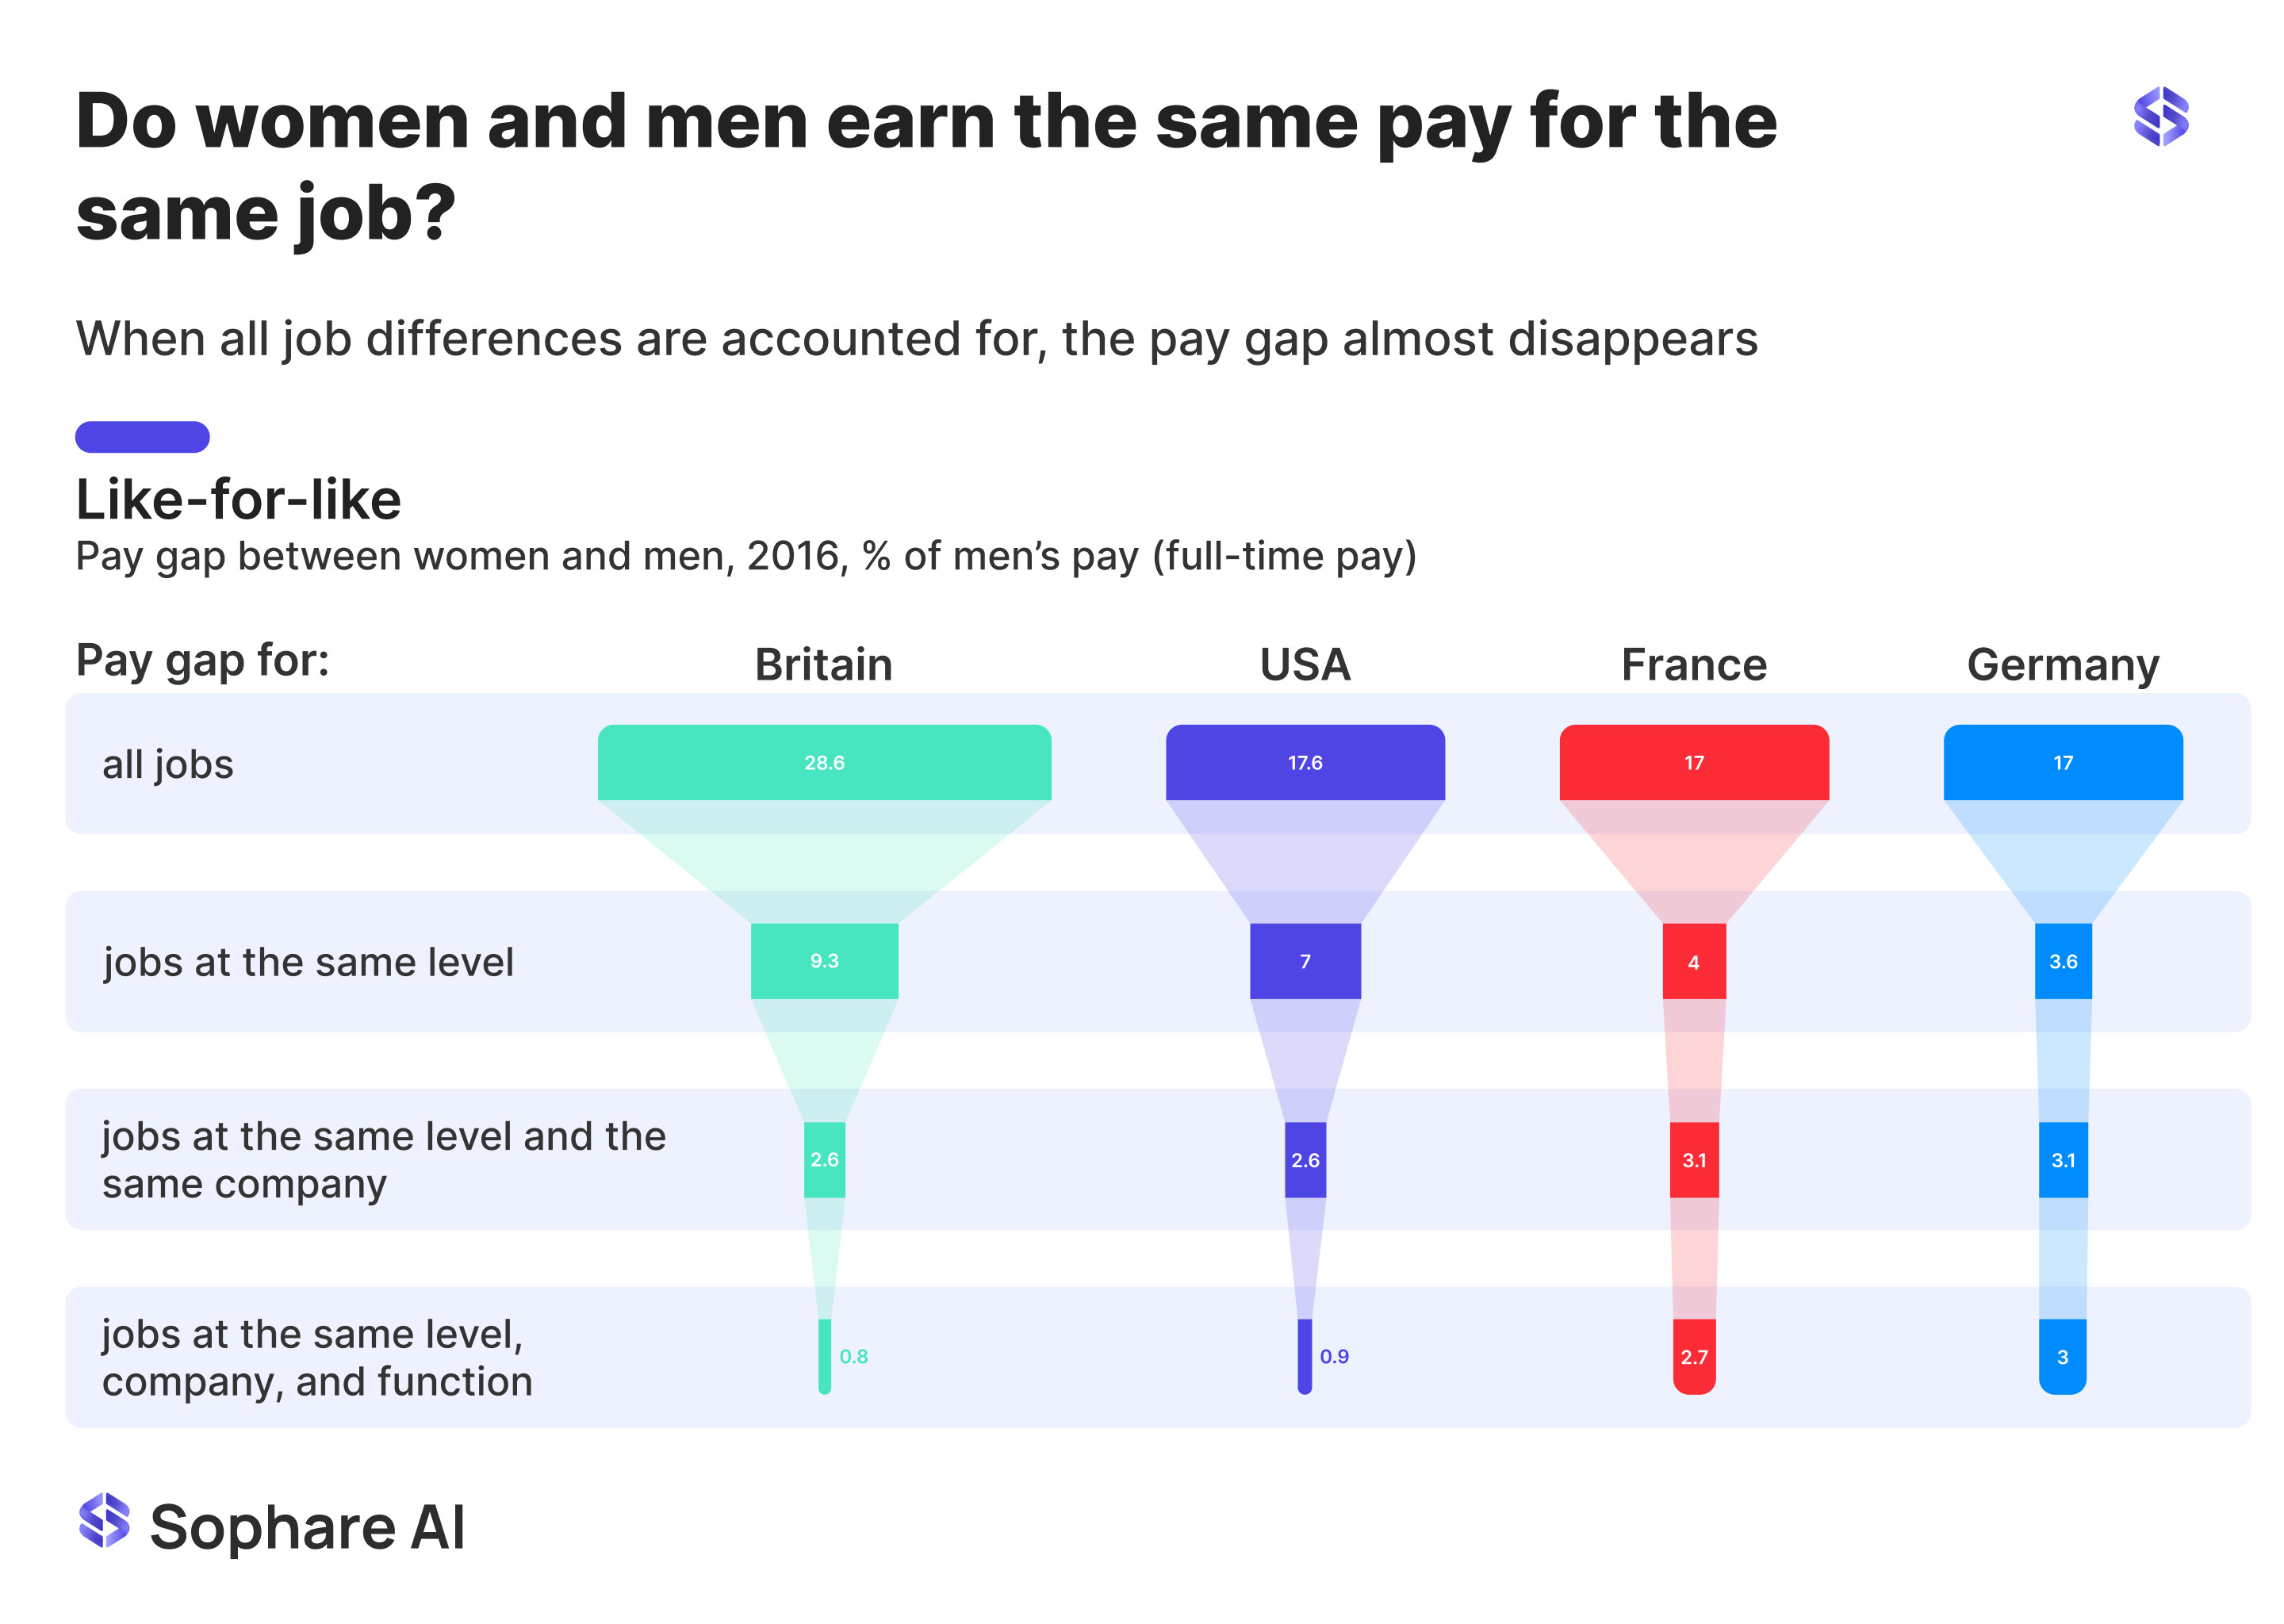
Each of these variables helps us control for "neutral, job-related factors"—a core requirement under pay transparency laws and statistical best practices. A good visualization shows how the gap shrinks with each control added. But here's the catch: deciding which variables to include is somewhat subjective.
An Example Adjusted Pay Gap Calculation
Suppose you've built a linear regression model to predict base salary. You include gender (coded for women, for men) and control for job level, tenure, and location.
Your regression output might look like this:
More formally, this can be written as a linear regression model:
Where:
- is the predicted salary for individual i
- β₁ represents the gender coefficient (the adjusted pay gap)
- is the error term
If the coefficient β₁ = -4,000, this means—holding all else constant—women are predicted to earn $4,000 less than men.
To express this as a percentage:
If the average salary for comparable men is $100,000, then:
This means women are paid 4% less than men after accounting for level, tenure, and location.
Real-world analysis often uses log-transformed salaries, additional controls, and other variable transformations to get as close to ground truth as possible.
Assumptions Behind Adjusted Pay Gap Models
Ceteris Paribus: All Else Equal
The regression approach assumes we have accounted for all measurable productivity-related factors (experience, occupation, education, hours, etc.), so that β₁ isolates the pay difference unexplained by these factors. In effect, the formula imagines a hypothetical scenario where a woman and a man are identical in all qualifications and job traits. β₁ then captures the remaining pay gap in that scenario. This is why the adjusted gap is often called the "unexplained" gap (the portion not explained by differences in job characteristics). An implicit assumption is that any omitted variables are either unimportant or affect men and women similarly; otherwise β₁ may also absorb those effects.
Equal Work, Equal Value... Says Who?
The core principle behind adjusted gap analysis is that people doing "equal work of equal value" should be paid the same. But defining equal value is rarely clear-cut. Is a senior software engineer "equal" to a senior designer? Is a “manager” in finance “equal” to a “manager” in product? What about two data analysts, one building dashboards, the other auditing pipelines?
These questions don't have one right answer; they have tradeoffs. That's why calculating an adjusted pay gap is not just math. It's judgment.
Data Preparation: The Hidden Tax
Calculating an adjusted pay gap begins before the math, with your data. To get meaningful, defensible, and even more favorable results, companies need to:
-
Group employees doing substantially similar work into "equal work" groups or cohorts. This typically involves evaluating jobs using four key criteria recognized in U.S. equal pay laws and echoed in many other Western legal frameworks: skill, effort, responsibility, and working conditions. These four are foundational, but they are not exhaustive. Employers have the opportunity to go further by collecting and testing additional variables that may explain pay, like remote versus non-remote status, potential prior experience, or performance scores (when measured reliably). Including additional variables in modeling can improve the accuracy of your analysis and help ensure your definition of "equal work" reflects how work is actually done in your organization.
-
Standardize compensation data across currencies, contract types, and bonus structures. This includes base pay, discretionary pay (bonuses, commissions), and in-kind benefits, all expressed in a consistent format. Companies should be mindful of point-in-time currency conversions as we have seen this factor alone tip a company's pay gap into "mandatory action" territory.
-
Specify protected categories (like gender or race/ethnicity, depending on jurisdiction) and ensure these are captured cleanly for analysis. Companies will need to address missing demographic data and develop thoughtful approaches for categorizing and analyzing gender identities beyond the binary, in ways that honor individual self-identification while preserving statistical validity.
-
Organize data for statistical modeling, including the variables above as "controls" and potentially transforming fields (e.g., squaring or exponentiating tenure to reflect diminishing or expounding returns over time, or log-transforming pay).
This data prep is often the most time-consuming and where companies get stuck.
Most buyers of pay equity tools never see the underbelly of what it takes to make their data fit. Legacy SaaS software vendors make it worse, forcing hours of spreadsheet gymnastics just to match outdated templates. The math isn’t the problem. The data prep is.
Here’s the truth most pay equity solutions won’t admit: whether you use an enterprise tool or a free government one, the heaviest lift still falls on your team. You’ll end up redeploying analysts, ops, and IT teams to wrangle data into rigid templates... just to get started on a one-shot analysis.
The desired destination spot for global pay equality work is to reach economies of scale. That means cost advantages due to efficiently scaling the production. As more countries come online in the pay transparency reporting space, it's becoming necessary that the work scales efficiently rather than becoming a barrier to productivity and incurring unjustified costs.
An AI-First Pay Transparency & Pay Equity Solution
Heavy-lift tasks like data cleaning are precisely where AI steps in, and it's where Sophare AI is different.
Sophare is built on agentic AI principles which deserve an AI-native architecture designed to eliminate the bottlenecks where legacy tools and billable-hour consultants fall short. Sophare's platform removes the grunt work from pay transparency and pay equity analyses, targeting the most impactful value-trapping tasks in the compliance workflow. Call it "AI-native compliance" and we blush 😊
Founder and CEO Siena Duplan has over a decade of experience at a Fortune 500 company engineering pay equity algorithms, data-cleaning scripts, and automation pipelines. Duplan built Sophare to eliminate 100% the friction in working with messy HRIS, ATS, and payroll data. Behind the scenes, Sophare's platform automatically formats, groups, cleans, and transforms workforce records, allowing your team to spend less time in spreadsheets and more time with insights.
Equal Pay = Science + Art + Iteration
We've worked with companies who started with 30% adjusted pay gaps, then refined their job leveling, cleaned their data, and came out with much more accurate, and often smaller, gaps. Each step requires decisions, an agile platform, and a system that allows for rapid comparison, testing, and iteration across teams, definitions, and jurisdictions. An agentic AI platform like Sophare outperforms old-school vendors, because it is purpose-built to handle dynamic, exploratory analysis rather than static, one-off reports.
A good pay equity solution won't just give you a number or a dashboard. It will walk you through grouping logic, flag weak assumptions, and help your HR team iterate with the speed and agility of your best engineers.
A Centralized Solution
Still building your adjusted pay gap analysis in Excel or R? We respect the DIY-spirit, and we’re always happy to share knowledge. But even Fortune 500 companies end up bleeding time and resources to keep the process clean, repeatable, and audit-ready. Modern pay equity tools like Sophare AI exist to help People teams automate low-value transactions and focus on making better pay decisions for your people and your bottom line.
Ready to never look at a spreadsheet again? Try a platform like Sophare AI to streamline the analysis of pay gaps, collaborate with stakeholders, and stay compliant ahead of growing pay transparency laws with flexible transparency tools that tailor to your leadership’s comfort zone.